fourier_vec() calculates a Fourier Series from a date or date-time index.
Usage
fourier_vec(x, period, K = 1, type = c("sin", "cos"), scale_factor = NULL)Arguments
- x
A date, POSIXct, yearmon, yearqtr, or numeric sequence (scaled to difference 1 for
periodalignment) to be converted to a fourier series.- period
The number of observations that complete one cycle.
- K
The fourier term order.
- type
Either "sin" or "cos" for the appropriate type of fourier term.
- scale_factor
Scale factor is a calculated value that scales date sequences to numeric sequences. A user can provide a different value of scale factor to override the date scaling. Default: NULL (auto-scale).
Details
Benefits:
This function is NA padded by default so it works well with dplyr::mutate() operations.
Fourier Series Calculation
The internal calculation is relatively straightforward:
fourier(x) = sin(2 * pi * term * x) or cos(2 * pi * term * x),
where term = K / period.
Period Alignment, period
The period alignment with the sequence is an essential part of fourier series calculation.
Date, Date-Time, and Zoo (yearqtr and yearmon) Sequences - Are scaled to unit difference of 1. This happens internally, so there's nothing you need to do or to worry about. Future time series will be scaled appropriately.
Numeric Sequences - Are not scaled, which means you should transform them to a unit difference of 1 so that your x is a sequence that increases by 1. Otherwise your period and fourier order will be incorrectly calculated. The solution is to just take your sequence and divide by the median difference between values.
Fourier Order, K
The fourier order is a parameter that increases the frequency. K = 2 doubles the frequency.
It's common in time series analysis to add multiple fourier orders (e.g. 1 through 5) to account for
seasonalities that occur faster than the primary seasonality.
Type (Sin/Cos)
The type of the fourier series can be either sin or cos. It's common in time series analysis
to add both sin and cos series.
See also
Fourier Modeling Functions:
step_fourier()- Recipe fortidymodelsworkflowtk_augment_fourier()- Adds many fourier series to adata.frame(tibble)
Additional Vector Functions:
Fourier Series:
fourier_vec()Box Cox Transformation:
box_cox_vec()Lag Transformation:
lag_vec()Differencing Transformation:
diff_vec()Rolling Window Transformation:
slidify_vec()Loess Smoothing Transformation:
smooth_vec()Missing Value Imputation for Time Series:
ts_impute_vec(),ts_clean_vec()
Examples
library(dplyr)
# Set max.print to 50
options_old <- options()$max.print
options(max.print = 50)
date_sequence <- tk_make_timeseries("2016-01-01", "2016-01-31", by = "hour")
# --- VECTOR ---
fourier_vec(date_sequence, period = 7 * 24, K = 1, type = "sin")
#> [1] 0.7818315 0.8045978 0.8262388 0.8467242 0.8660254 0.8841154 0.9009689
#> [8] 0.9165623 0.9308737 0.9438833 0.9555728 0.9659258 0.9749279 0.9825665
#> [15] 0.9888308 0.9937122 0.9972038 0.9993007 1.0000000 0.9993007 0.9972038
#> [22] 0.9937122 0.9888308 0.9825665 0.9749279 0.9659258 0.9555728 0.9438833
#> [29] 0.9308737 0.9165623 0.9009689 0.8841154 0.8660254 0.8467242 0.8262388
#> [36] 0.8045978 0.7818315 0.7579717 0.7330519 0.7071068 0.6801727 0.6522874
#> [43] 0.6234898 0.5938202 0.5633201 0.5320321 0.5000000 0.4672686 0.4338837
#> [50] 0.3998920
#> [ reached 'max' / getOption("max.print") -- omitted 671 entries ]
# --- MUTATE ---
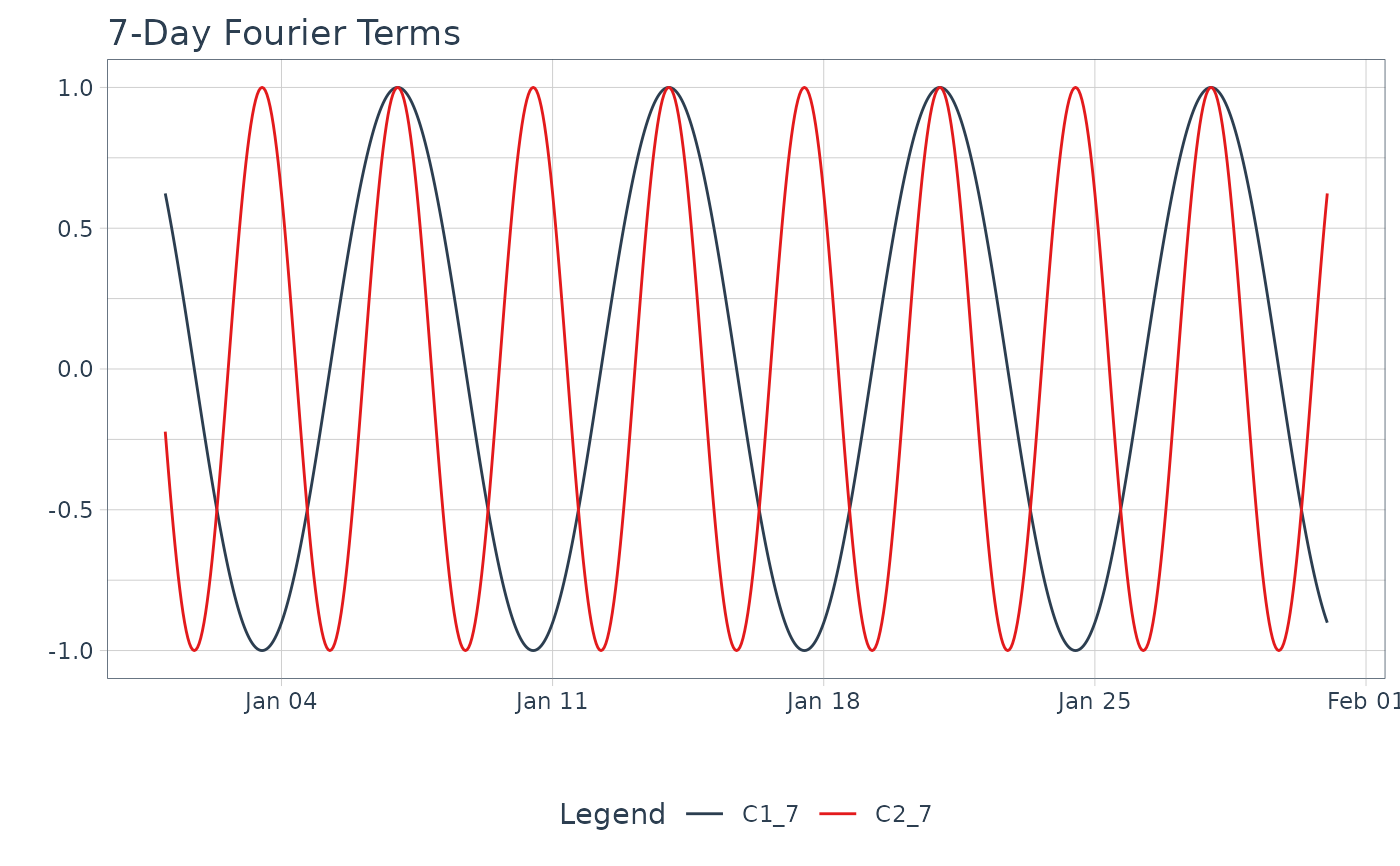
tibble(date = date_sequence) %>%
# Add cosine series that oscilates at a 7-day period
mutate(
C1_7 = fourier_vec(date, period = 7*24, K = 1, type = "cos"),
C2_7 = fourier_vec(date, period = 7*24, K = 2, type = "cos")
) %>%
# Visualize
tidyr::pivot_longer(cols = contains("_"), names_to = "name", values_to = "value") %>%
plot_time_series(
date, value, .color_var = name,
.smooth = FALSE,
.interactive = FALSE,
.title = "7-Day Fourier Terms"
)
 options(max.print = options_old)