Visualize a Time Series Resample Plan
Source:R/rsample-plot_time_series_cv_plan.R
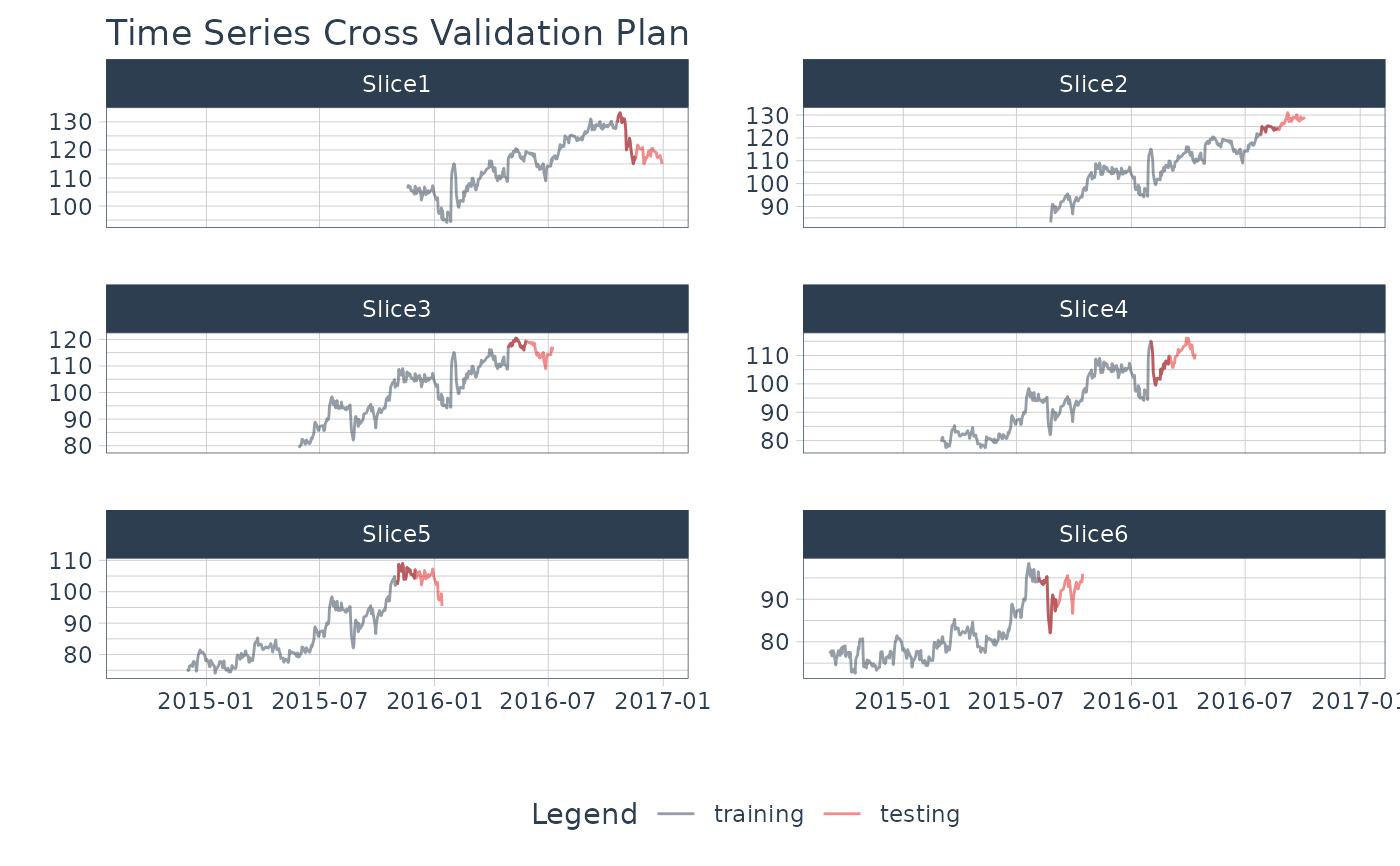
plot_time_series_cv_plan.RdThe plot_time_series_cv_plan() function provides a visualization
for a time series resample specification (rset) of either rolling_origin
or time_series_cv class.
Usage
plot_time_series_cv_plan(
  .data,
  .date_var,
  .value,
  ...,
  .smooth = FALSE,
  .title = "Time Series Cross Validation Plan"
)
Arguments
- .data
A time series resample specification of of either
rolling_originortime_series_cvclass or a data frame (tibble) that has been prepared usingtk_time_series_cv_plan().- .date_var
A column containing either date or date-time values
- .value
A column containing numeric values
- ...
Additional parameters passed to
plot_time_series()- .smooth
Logical - Whether or not to include a trendline smoother. Uses See
smooth_vec()to apply a LOESS smoother.- .title
Title for the plot
Value
Returns a static ggplot or interactive plotly object depending on
whether or not .interactive is FALSE or TRUE, respectively.
Details
Resample Set
A resample set is an output of the timetk::time_series_cv() function or the
rsample::rolling_origin() function.
See also
time_series_cv()andrsample::rolling_origin()- Functions used to create time series resample specfications.plot_time_series_cv_plan()- The plotting function used for visualizing the time series resample plan.
Examples
library(dplyr)
library(rsample)

FB_tbl <- FANG %>%
    filter(symbol == "FB") %>%
    select(symbol, date, adjusted)

resample_spec <- time_series_cv(
    FB_tbl,
    initial = "1 year",
    assess  = "6 weeks",
    skip    = "3 months",
    lag     = "1 month",
    cumulative  = FALSE,
    slice_limit = 6
)
#> Using date_var: date

resample_spec %>% tk_time_series_cv_plan()
#> # A tibble: 1,812 × 5
#>    .id    .key     symbol date       adjusted
#>    <chr>  <fct>    <chr>  <date>        <dbl>
#>  1 Slice1 training FB     2015-11-19     106.
#>  2 Slice1 training FB     2015-11-20     107.
#>  3 Slice1 training FB     2015-11-23     107.
#>  4 Slice1 training FB     2015-11-24     106.
#>  5 Slice1 training FB     2015-11-25     105.
#>  6 Slice1 training FB     2015-11-27     105.
#>  7 Slice1 training FB     2015-11-30     104.
#>  8 Slice1 training FB     2015-12-01     107.
#>  9 Slice1 training FB     2015-12-02     106.
#> 10 Slice1 training FB     2015-12-03     104.
#> # ℹ 1,802 more rows

resample_spec %>%
    tk_time_series_cv_plan() %>%
    plot_time_series_cv_plan(
        date, adjusted, # date variable and value variable
        # Additional arguments passed to plot_time_series(),
        .facet_ncol = 2,
        .line_alpha = 0.5,
        .interactive = FALSE
    )