# Imports and Data
import pytimetk as tk
df = tk.load_dataset('m4_monthly', parse_dates = ['date'])
# Plotly Object: Single Time Series
fig = (
df
.query('id == "M750"')
.plot_timeseries(
'date', 'value',
facet_ncol = 1,
x_axis_date_labels = "%Y",
engine = 'plotly',
)
)
figplot_timeseries
plot_timeseries(
    data,
    date_column,
    value_column,
    color_column=None,
    color_palette=None,
    facet_ncol=1,
    facet_nrow=None,
    facet_scales='free_y',
    facet_dir='h',
    line_color='#2c3e50',
    line_size=None,
    line_type='solid',
    line_alpha=1.0,
    y_intercept=None,
    y_intercept_color='#2c3e50',
    x_intercept=None,
    x_intercept_color='#2c3e50',
    smooth=True,
    smooth_color='#3366FF',
    smooth_frac=0.2,
    smooth_size=1.0,
    smooth_alpha=1.0,
    legend_show=True,
    title='Time Series Plot',
    x_lab='',
    y_lab='',
    color_lab='Legend',
    x_axis_date_labels='%b %Y',
    base_size=11,
    width=None,
    height=None,
    engine='plotly',
    plotly_dropdown=False,
    plotly_dropdown_x=0,
    plotly_dropdown_y=1,
)
Creates time series plots using different plotting engines such as Plotnine, Matplotlib, and Plotly.
Parameters
| Name | Type | Description | Default |
|---|---|---|---|
| data | pd.DataFrame or pd.core.groupby.generic.DataFrameGroupBy | The input data for the plot. It can be either a Pandas DataFrame or a Pandas DataFrameGroupBy object. | required |
| date_column | str or ColumnSelector | The name (or tidy selector) of the column in the DataFrame that contains the dates for the time series data. | required |
| value_column | str, ColumnSelector, or list | The value_column parameter is used to specify the name of the column in the DataFrame that contains the values for the time series data. This column will be plotted on the y-axis of the time series plot. LONG-FORMAT PLOTTING: If the value_column parameter is a string, it will be treated as a single column name. To plot multiple time series, group the DataFrame first using pd.DataFrame.groupby(). WIDE-FORMAT PLOTTING: If the value_column parameter is a list, it will plotted as multiple time series (wide-format). |
required |
| color_column | str, ColumnSelector, or list | The color_column parameter is an optional parameter that specifies the column in the DataFrame that will be used to assign colors to the different time series. If this parameter is not provided, all time series will have the same color. LONG-FORMAT PLOTTING: The color_column parameter is a single column name. WIDE-FORMAT PLOTTING: The color_column parameter must be the same list as the value_column parameter to color the different time series when performing wide-format plotting. |
None |
| color_palette | list | The color_palette parameter is used to specify the colors to be used for the different time series. It accepts a list of color codes or names. If the color_column parameter is not provided, the tk.palette_timetk() color palette will be used. |
None |
| facet_ncol | int | The facet_ncol parameter determines the number of columns in the facet grid. It specifies how many subplots will be arranged horizontally in the plot. |
1 |
| facet_nrow | int | The facet_nrow parameter determines the number of rows in the facet grid. It specifies how many subplots will be arranged vertically in the grid. |
None |
| facet_scales | str | The facet_scales parameter determines the scaling of the y-axis in the facetted plots. It can take the following values: - “free_y”: The y-axis scale will be free for each facet, but the x-axis scale will be fixed for all facets. This is the default value. - “free_x”: The y-axis scale will be free for each facet, but the x-axis scale will be fixed for all facets. - “free”: The y-axis scale will be free for each facet (subplot). This is the default value. |
'free_y' |
| facet_dir | str | The facet_dir parameter determines the direction in which the facets (subplots) are arranged. It can take two possible values: - “h”: The facets will be arranged horizontally (in rows). This is the default value. - “v”: The facets will be arranged vertically (in columns). |
'h' |
| line_color | str | The line_color parameter is used to specify the color of the lines in the time series plot. It accepts a string value representing a color code or name. The default value is “#2c3e50”, which corresponds to a dark blue color. |
'#2c3e50' |
| line_size | float | The line_size parameter is used to specify the size of the lines in the time series plot. It determines the thickness of the lines. |
None |
| line_type | str | The line_type parameter is used to specify the type of line to be used in the time series plot. |
'solid' |
| line_alpha | float | The line_alpha parameter controls the transparency of the lines in the time series plot. It accepts a value between 0 and 1, where 0 means completely transparent (invisible) and 1 means completely opaque (solid). |
1.0 |
| y_intercept | float | The y_intercept parameter is used to add a horizontal line to the plot at a specific y-value. It can be set to a numeric value to specify the y-value of the intercept. If set to None (default), no y-intercept line will be added to the plot |
None |
| y_intercept_color | str | The y_intercept_color parameter is used to specify the color of the y-intercept line in the plot. It accepts a string value representing a color code or name. The default value is “#2c3e50”, which corresponds to a dark blue color. You can change this value. |
'#2c3e50' |
| x_intercept | str | The x_intercept parameter is used to add a vertical line at a specific x-axis value on the plot. It is used to highlight a specific point or event in the time series data. - By default, it is set to None, which means no vertical line will be added. - You can use a date string to specify the x-axis value of the intercept. For example, “2020-01-01” would add a vertical line at the beginning of the year 2020. |
None |
| x_intercept_color | str | The x_intercept_color parameter is used to specify the color of the vertical line that represents the x-intercept in the plot. By default, it is set to “#2c3e50”, which is a dark blue color. You can change this value to any valid color code. |
'#2c3e50' |
| smooth | bool | The smooth parameter is a boolean indicating whether or not to apply smoothing to the time eries data. If set to True, the time series will be smoothed using the lowess algorithm. The default value is True. |
True |
| smooth_color | str | The smooth_color parameter is used to specify the color of the smoothed line in the time series plot. It accepts a string value representing a color code or name. The default value is #3366FF, which corresponds to a shade of blue. You can change this value to any valid color code. |
'#3366FF' |
| smooth_frac | float | The smooth_frac parameter is used to control the fraction of data points used for smoothing the time series. It determines the degree of smoothing applied to the data. A smaller value of smooth_frac will result in more smoothing, while a larger value will result in less smoothing. The default value is 0.2. |
0.2 |
| smooth_size | float | The smooth_size parameter is used to specify the size of the line used to plot the smoothed values in the time series plot. It is a numeric value that controls the thickness of the line. A larger value will result in a thicker line, while a smaller value will result in a thinner line |
1.0 |
| smooth_alpha | float | The smooth_alpha parameter controls the transparency of the smoothed line in the plot. It accepts a value between 0 and 1, where 0 means completely transparent and 1 means completely opaque. |
1.0 |
| legend_show | bool | The legend_show parameter is a boolean indicating whether or not to show the legend in the plot. If set to True, the legend will be displayed. The default value is True. |
True |
| title | str | The title of the plot. | 'Time Series Plot' |
| x_lab | str | The x_lab parameter is used to specify the label for the x-axis in the plot. It is a string that represents the label text. |
'' |
| y_lab | str | The y_lab parameter is used to specify the label for the y-axis in the plot. It is a string that represents the label for the y-axis. |
'' |
| color_lab | str | The color_lab parameter is used to specify the label for the legend or color scale in the plot. It is used to provide a description of the colors used in the plot, typically when a color column is specified. |
'Legend' |
| x_axis_date_labels | str | The x_axis_date_labels parameter is used to specify the format of the date labels on the x-axis of the plot. It accepts a string representing the format of the date labels. For example, “%b %Y” would display the month abbreviation and year (e.g., Jan 2020). |
'%b %Y' |
| base_size | float | The base_size parameter is used to set the base font size for the plot. It determines the size of the text elements such as axis labels, titles, and legends. |
11 |
| width | int | The width parameter is used to specify the width of the plot. It determines the horizontal size of the plot in pixels. |
None |
| height | int | The height parameter is used to specify the height of the plot in pixels. It determines the vertical size of the plot when it is rendered. |
None |
| engine | str | The engine parameter specifies the plotting library to use for creating the time series plot. It can take one of the following values: - “plotly” (interactive): Use the plotly library to create the plot. This is the default value. - “plotnine” (static): Use the plotnine library to create the plot. This is the default value. - “matplotlib” (static): Use the matplotlib library to create the plot. |
'plotly' |
| plotly_dropdown | bool | For analyzing many plots. When set to True and groups are provided, the function switches from faceting to create a dropdown menu to switch between different groups. Default: False. |
False |
| plotly_dropdown_x | float | The x-axis location of the dropdown. Default: 0. | 0 |
| plotly_dropdown_y | float | The y-axis location of the dropdown. Default: 1. | 1 |
Returns
| Name | Type | Description |
|---|---|---|
The function plot_timeseries returns a plot object, depending on the |
specified engine parameter. - If engine is set to ‘plotnine’ or ‘matplotlib’, the function returns a plot object that can be further customized or displayed. - If engine is set to ‘plotly’, the function returns a plotly figure object. |
Examples
# Plotly Object: Grouped Time Series (Facets)
fig = (
    df
        .groupby('id')
        .plot_timeseries(
            'date', 'value',
            facet_ncol = 2,
            facet_scales = "free_y",
            smooth_frac = 0.2,
            smooth_size = 2.0,
            y_intercept = None,
            x_axis_date_labels = "%Y",
            engine = 'plotly',
            width = 600,
            height = 500,
        )
)
fig
# Plotly Object: Grouped Time Series (Plotly Dropdown)
fig = (
df
.groupby('id')
.plot_timeseries(
'date', 'value',
facet_scales = "free_y",
smooth_frac = 0.2,
smooth_size = 2.0,
y_intercept = None,
x_axis_date_labels = "%Y",
engine = 'plotly',
width = 600,
height = 500,
plotly_dropdown = True, # Plotly Dropdown
)
)
fig# Plotly Object: Color Column
fig = (
df
.plot_timeseries(
'date', 'value',
color_column = 'id',
smooth = False,
y_intercept = 0,
x_axis_date_labels = "%Y",
engine = 'plotly',
)
)
fig# Tidy selector example (Plotly)
from pytimetk.utils.selection import contains
fig = (
df
.plot_timeseries(
date_column='date',
value_column=contains('value'),
color_column=contains('id'),
engine='plotly',
)
)
fig# Plotnine Object: Single Time Series
fig = (
df
.query('id == "M1"')
.plot_timeseries(
'date', 'value',
x_axis_date_labels = "%Y",
engine = 'plotnine'
)
)
fig
<Figure Size: (700 x 500)># Plotnine Object: Grouped Time Series
fig = (
df
.groupby('id')
.plot_timeseries(
'date', 'value',
facet_ncol = 2,
facet_scales = "free",
line_size = 0.35,
x_axis_date_labels = "%Y",
engine = 'plotnine'
)
)
fig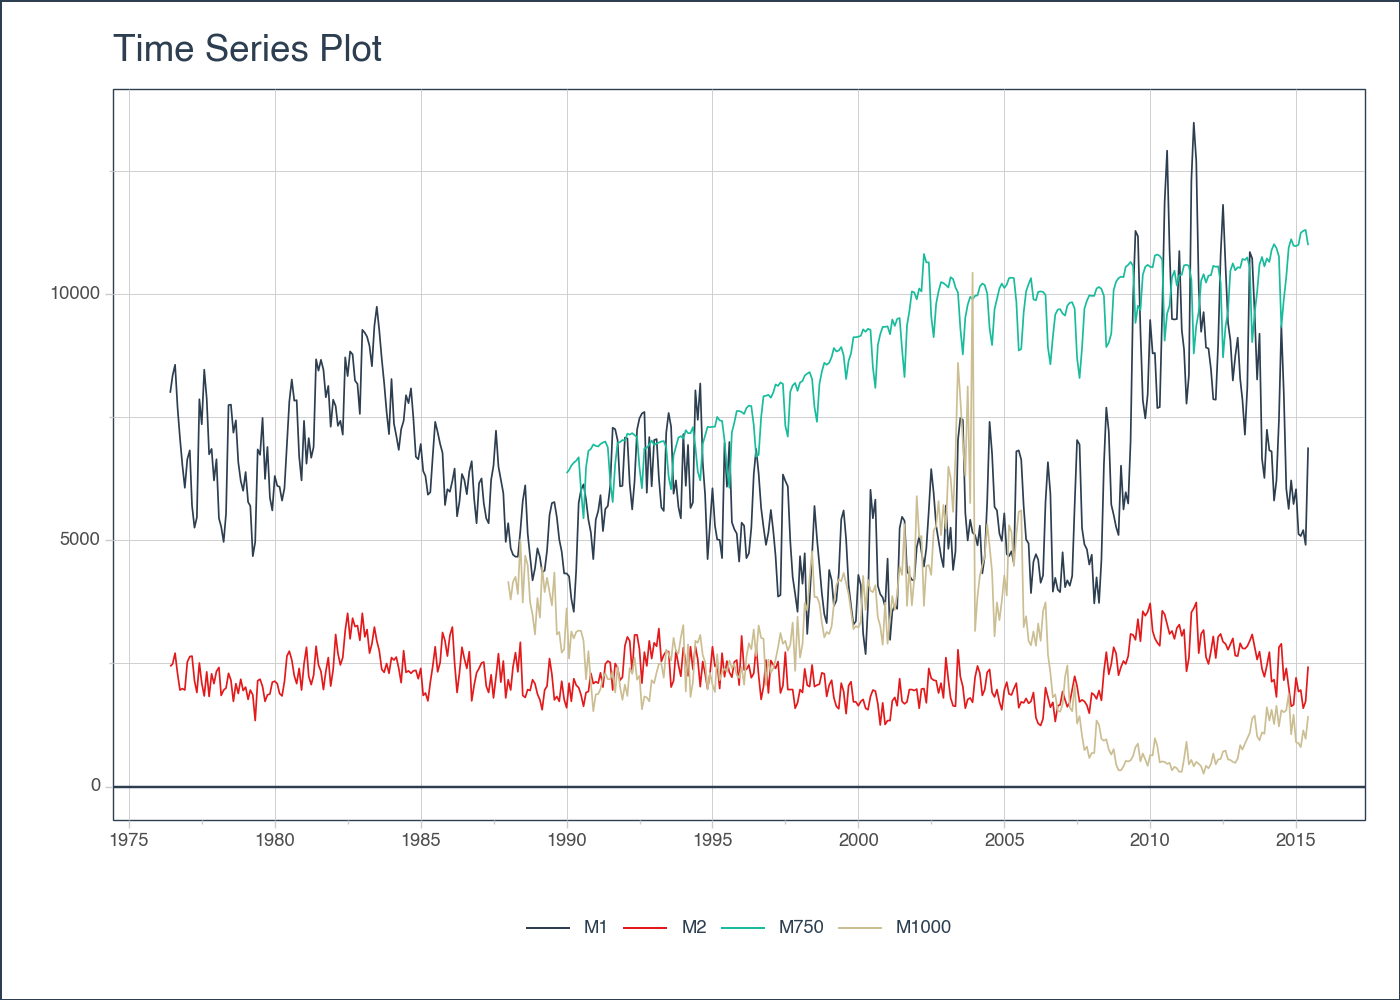
<Figure Size: (700 x 500)># Polars DataFrame using the tk accessor
import polars as pl
pl_df = pl.from_pandas(df[['id', 'date', 'value']])
pl_df.group_by('id').tk.plot_timeseries(
date_column='date',
value_column='value',
engine='plotly',
)# Plotnine Object: Color Column
fig = (
df
.plot_timeseries(
'date', 'value',
color_column = 'id',
smooth = False,
y_intercept = 0,
x_axis_date_labels = "%Y",
engine = 'plotnine',
)
)
fig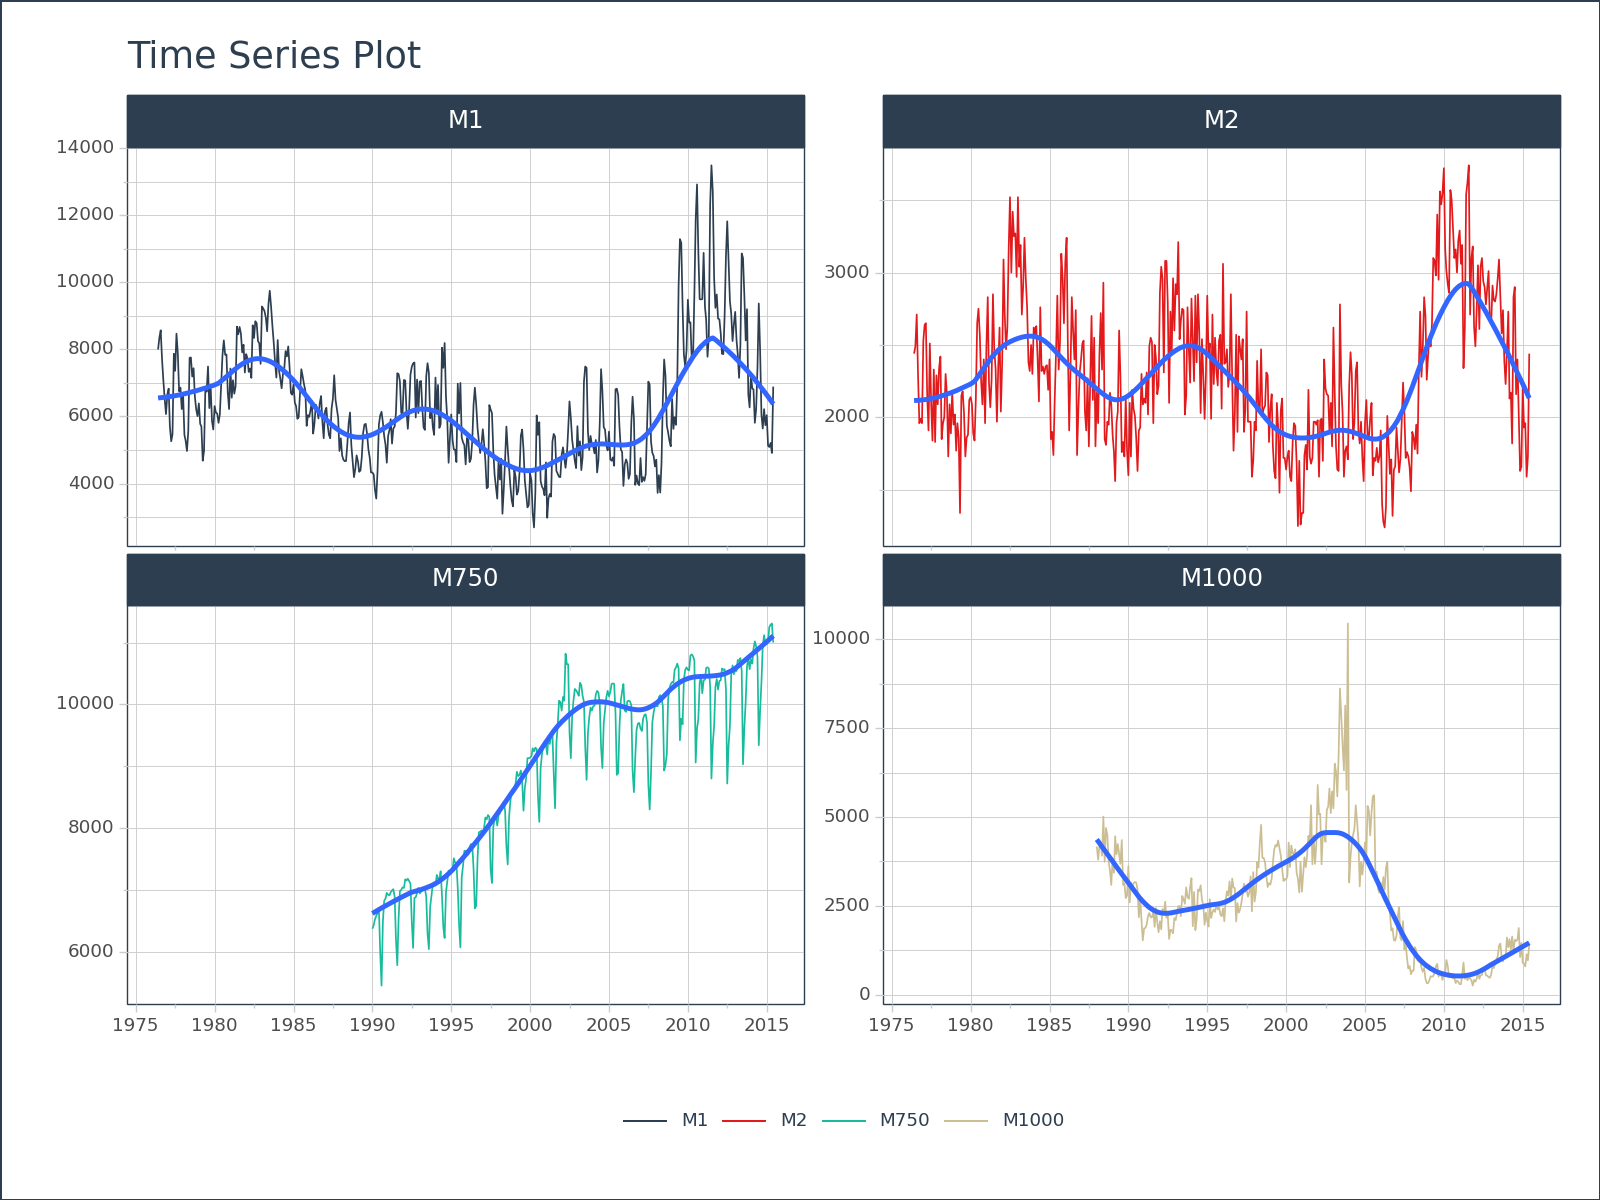
<Figure Size: (700 x 500)># Matplotlib object (same as plotnine, but converted to matplotlib object)
fig = (
df
.groupby('id')
.plot_timeseries(
'date', 'value',
color_column = 'id',
facet_ncol = 2,
x_axis_date_labels = "%Y",
engine = 'matplotlib',
)
)
fig
# Wide-Format Plotting

# Imports
import pandas as pd
import numpy as np
import pytimetk as tk

# Set a random seed for reproducibility
np.random.seed(42)

# Create a date range
dates = pd.date_range(start="2020-01-01", periods=100, freq="D")

# Generate random sales data and compute expenses and profit
sales = np.random.uniform(1000, 5000, len(dates))
expenses = sales * np.random.uniform(0.5, 0.8, len(dates))
profit = sales - expenses

# Create the DataFrame
df = pd.DataFrame({
    'date': dates,
    'sales': sales,
    'expenses': expenses,
    'profit': profit
})

(
    df
        .plot_timeseries(
            date_column = 'date',
            value_column = ['sales', 'expenses', 'profit'],
            color_column = ['sales', 'expenses', 'profit'],
            smooth = True,
            x_axis_date_labels = "%Y",
            engine = 'plotly',
            plotly_dropdown = True, # Plotly Dropdown
        )
)