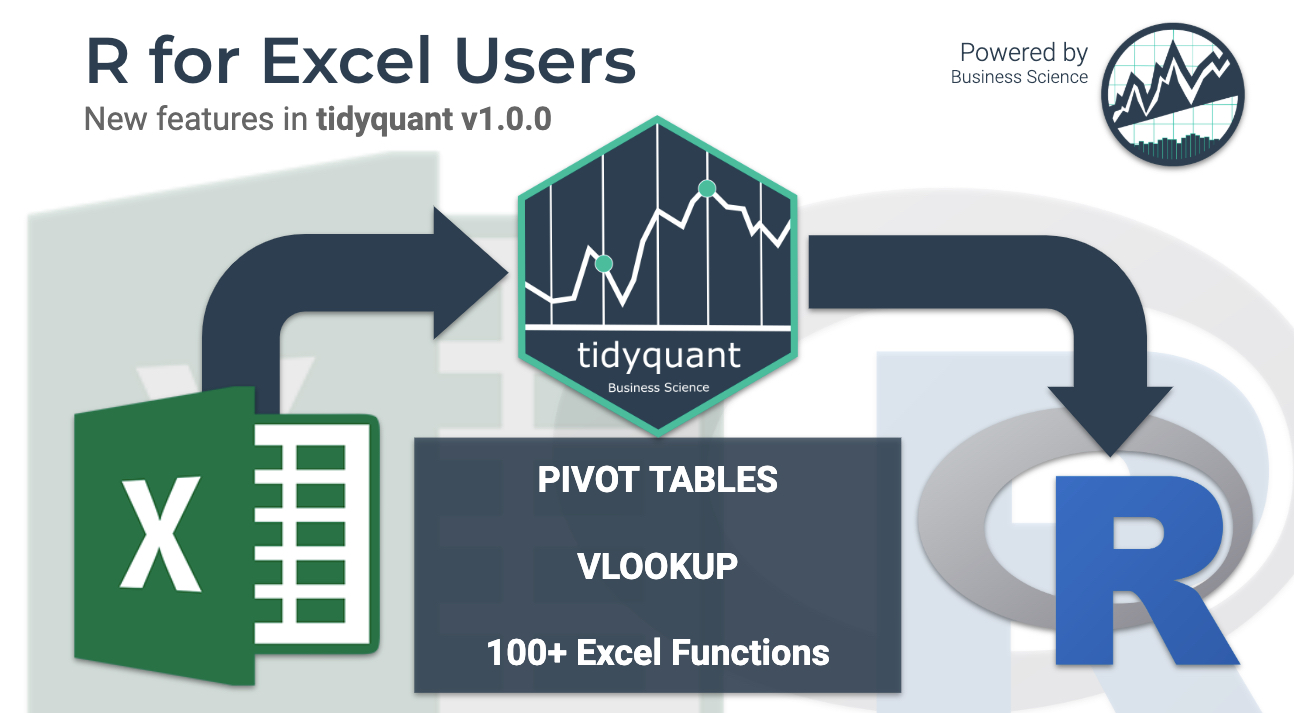
New business and financial analysts are finding R every day. Most of these new userRs (R users) are coming from a non-programming background. They have ample domain experience in functions like finance, marketing, and business, but their tool of choice is Excel (or more recently Tableau & PowerBI).
Learning R can be a major hurdle. You need to learn data structures, algorithms, data science, machine learning, web applications with Shiny and more to be able to accomplish a basic dashboard. This is a BIG ASK for non-coders. This is the problem I aim to begin solving with the upcoming release of tidyquant v1.0.0. Read the updated “R for Excel Users” Tutorial on Business Science.

