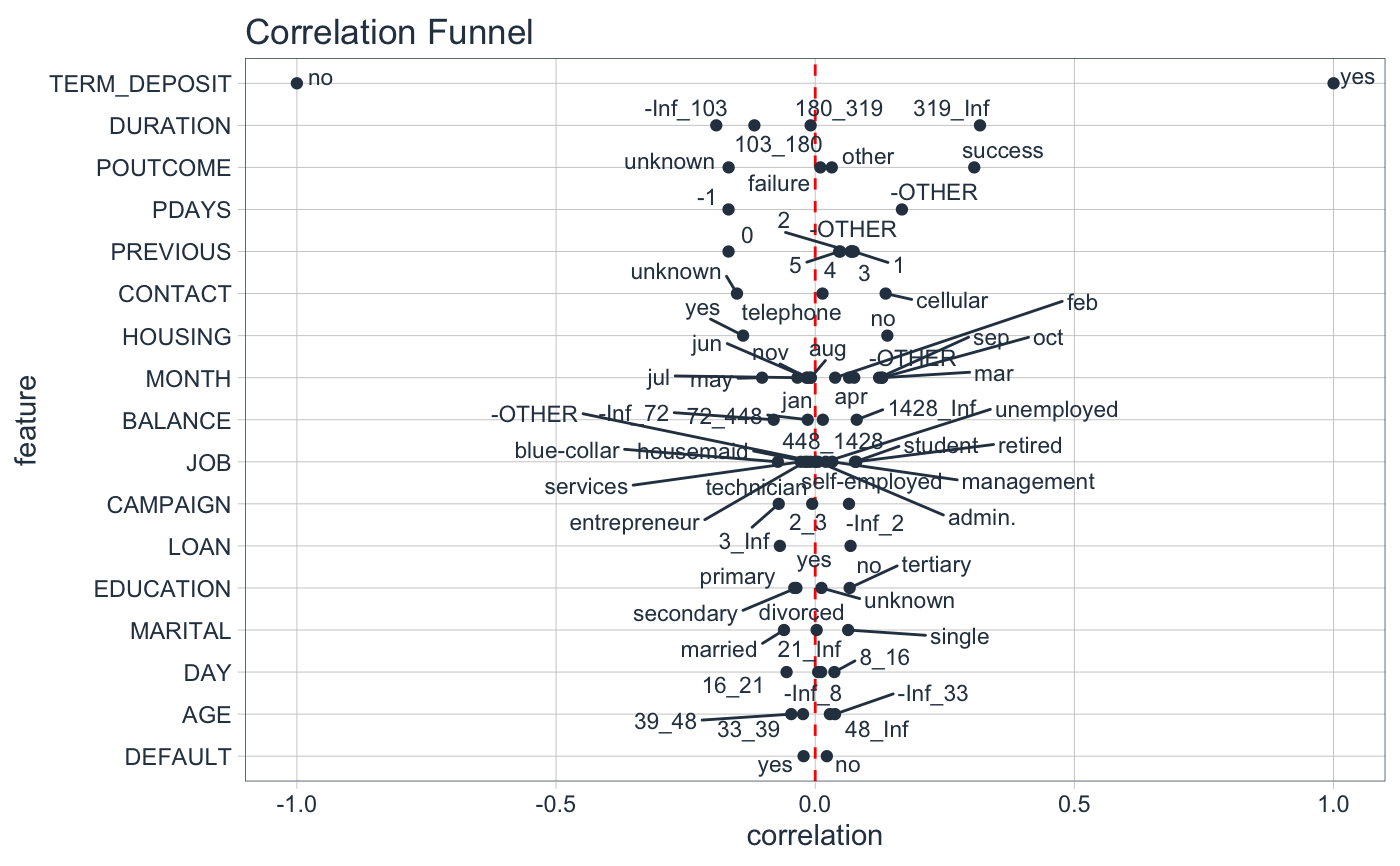
plot_correlation_funnel returns a correlation funnel visualization in either static (ggplot2) or
interactive (plotly) formats.
plot_correlation_funnel(
  data,
  interactive = FALSE,
  limits = c(-1, 1),
  alpha = 1
)
Arguments
| data | A |
|---|---|
| interactive | Returns either a static ( |
| limits | Sets the X-Axis limits for the correlation space |
| alpha | Sets the transparency of the points on the plot. |
Value
A static ggplot2 plot or an interactive plotly plot
See also
Examples
library(dplyr)
library(correlationfunnel)

marketing_campaign_tbl %>%
    select(-ID) %>%
    binarize() %>%
    correlate(TERM_DEPOSIT__yes) %>%
    plot_correlation_funnel()